I run Nine Signal, a minor league prospect tracker, and this fall we went back through every Low-A to Triple-A season from 2016 to 2022 (no 2020 season, obviously) to see which numbers show up in the guys who reached the majors within three years. That's about 22,000 player-seasons, anyone with 100+ PA or 100+ batters faced at a level.
Each number gets a score from 50 to 100. 50 means it sorts the guys who made it from the guys who didn't about as well as a coin flip, 100 would be perfect.
Single-A hitters (about 1 in 10 made it within 3 years)
| Number | Score |
|---|---|
| How he signed (draft round, international, undrafted) | 74 |
| Power (ISO) | 69 |
| Age for the level (younger is better) | 68 |
| Playing time | 68 |
| Walks minus strikeouts | 68 |
| Contact rate | 65 |
| Walk rate | 55 |
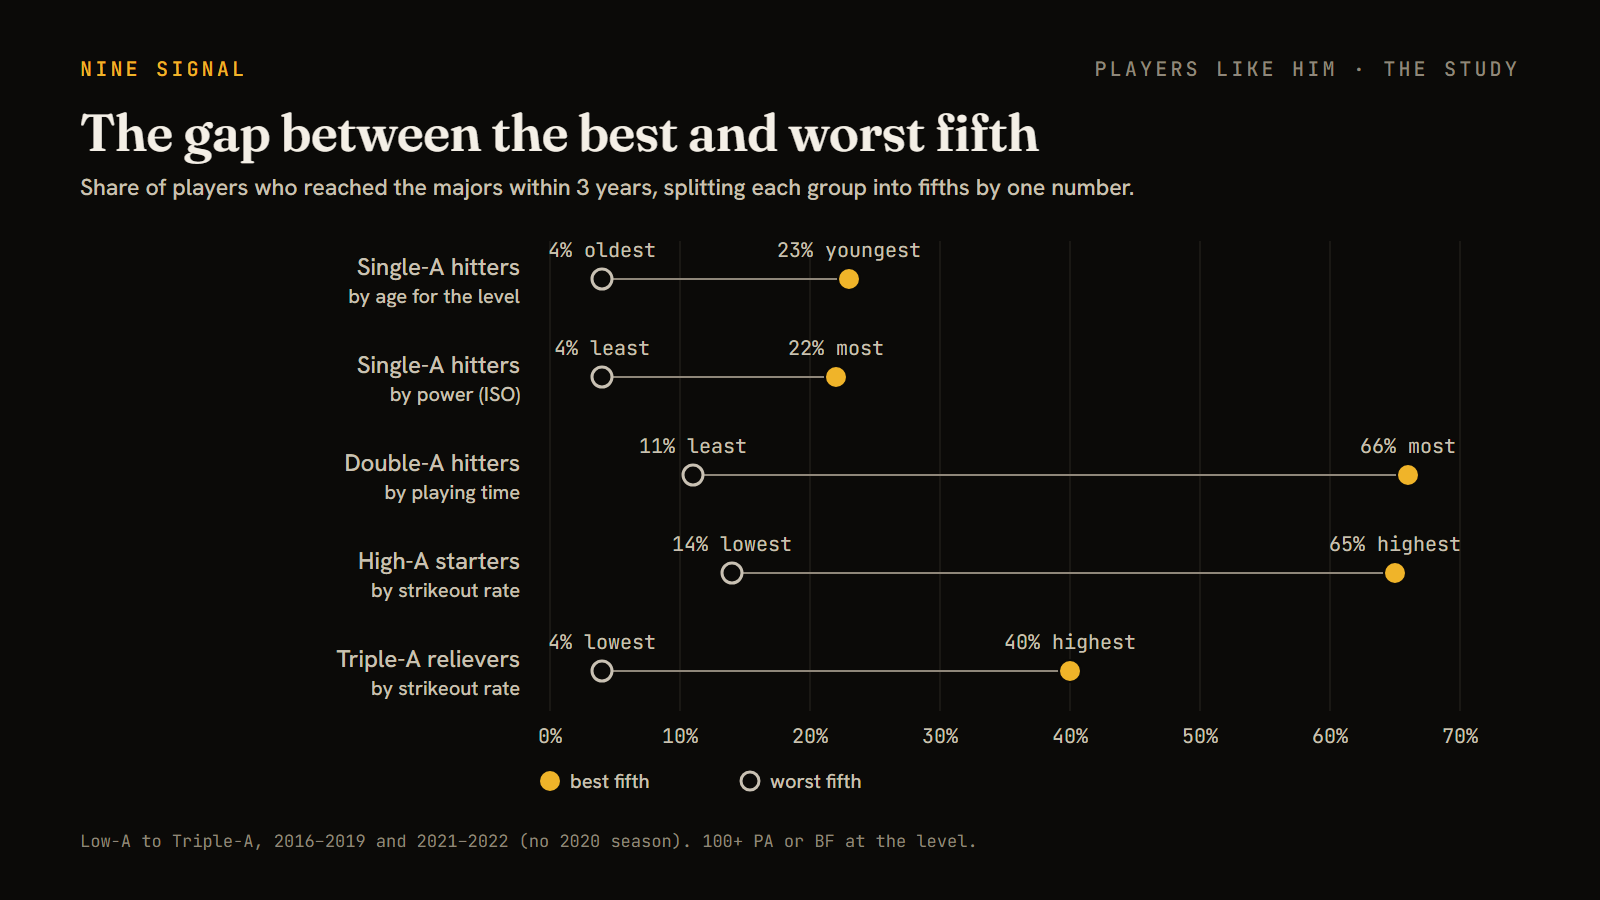
Splitting players into fifths makes it more concrete:
| Group | Split by | Best fifth | Worst fifth |
|---|---|---|---|
| Single-A hitters | age for level | 23% made it (youngest) | 4% (oldest) |
| Single-A hitters | power (ISO) | 22% | 4% |
| Double-A hitters | playing time | 66% | 11% |
| High-A starters | strikeout rate | 65% | 14% |
| Triple-A relievers | strikeout rate | 40% | 4% |
A few things that stood out:
- By Double-A, playing time is the top number for hitters (75). That doesn't prove the at-bats cause anything, but how much the team plays a guy tracks closely with whether he gets there.
- For pitchers it's strikeouts at almost every level. Strikeout rate, K-BB and swinging strikes fill the top of the list from Single-A to AAA. Stockyard Baseball did a Florida State League version of this and got K-BB% at 72; we got 67 for Single-A starters and 71 for Single-A relievers, so that lines up.
- Pitchers have had a harder time getting there since 2021. Double-A relievers made it 26 to 31% of the time in the 2016 to 2019 seasons and 15 to 21% for 2021 to 2023. High-A relievers went from 13 to 16% down to about 9 to 10%. Single-A hitters stayed between 8 and 14% the whole time. The timing lines up with MLB cutting affiliates to 120 in 2021, but this data alone can't prove that's the cause.
The part that didn't work
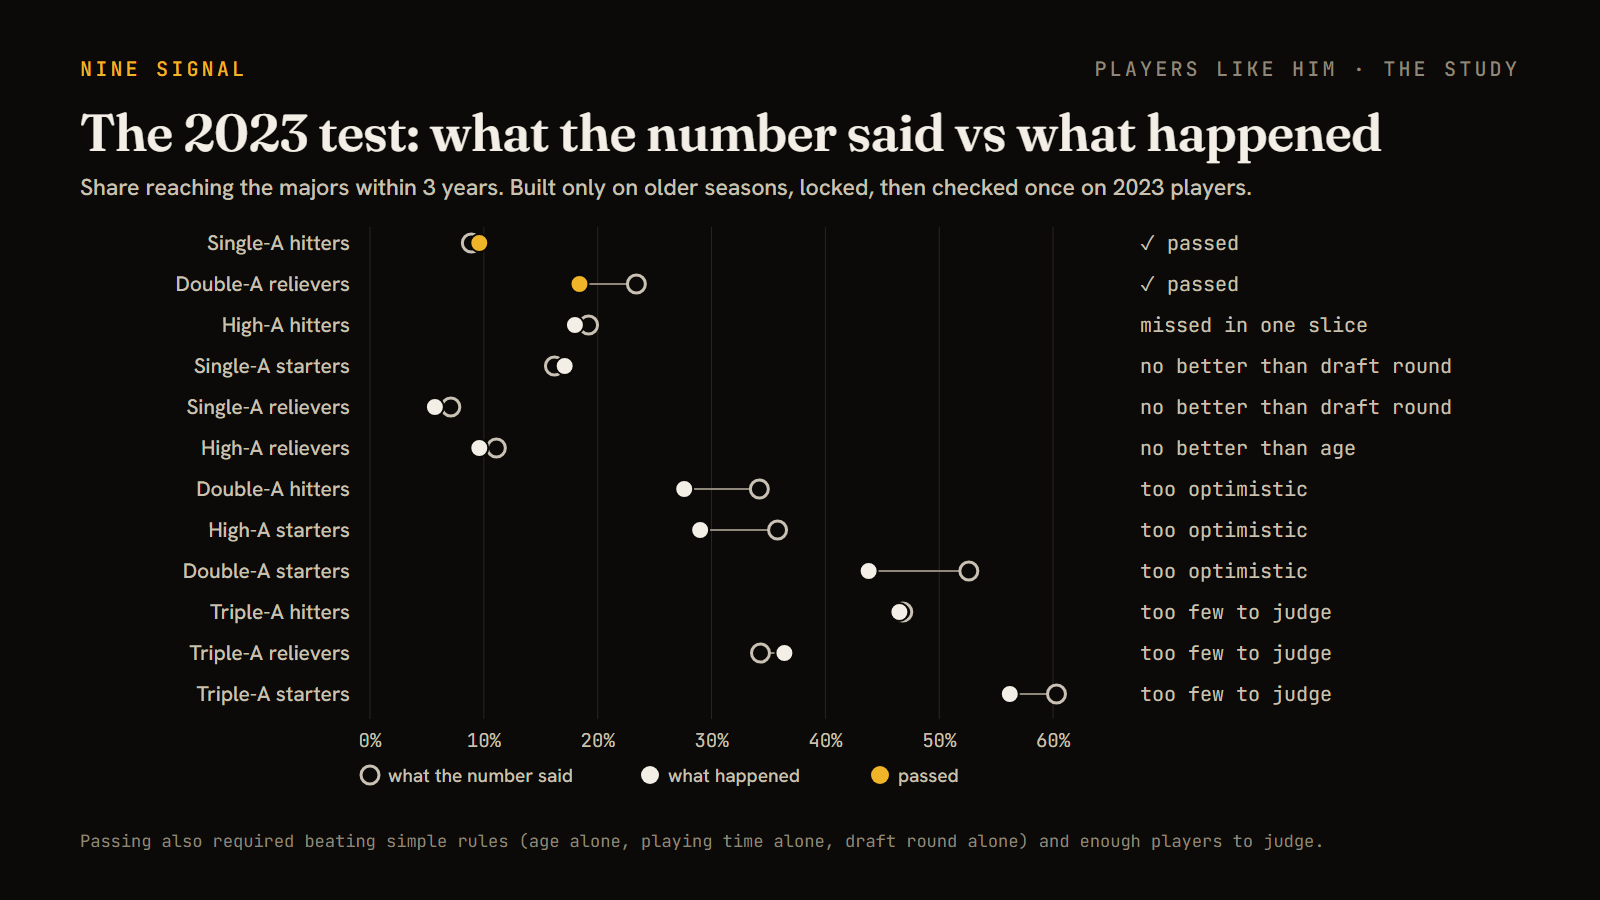
We also tried to build a "players like him" number: take a player, find the 50 to 150 past players at his level who looked most like him, and count how many made it. We built it only on older seasons, locked it, and checked it once on players it had never seen.
- First try (groups of 150, tested on 2021-22 players): passed for 0 of 12 level/role groups.
- Second try (group size picked per group, 3-year window, tested on 2023 players): passed for 2 of 12, Single-A hitters (it said about 9% would make it, about 10% did) and Double-A relievers.
- Where it missed it was mostly too optimistic: Double-A hitters, it said 34% and 28% made it. In a bunch of other groups it was close but no better than just using age or draft round.
So we're not putting it on player pages. We'll test it again once the 2024 class has had three years.